Korrector™ has been developed using state of the art computerized pressure testing equipment on live horses. Using this technology has meant that we can scientifically prove that Korrector™ really does do what we claim.
Korrector™ is designed by the same people that invented Flair – “Air Flocking for Saddles”tm and has been tested by Llywnon Saddlery, an independent test house, using the most up to date computerized pressure testing equipment available – the Novel Pliance System which has 256 sensors that are each scanned 40 times a second.
| Before | After |
|
|
|
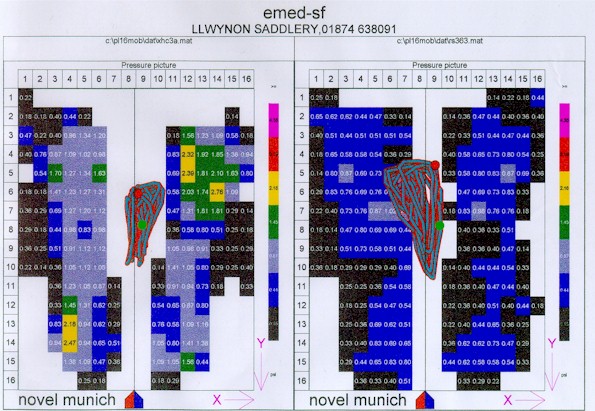
The pressure mat is placed under the saddle and saddlecloth and the horse ridden at the gaits required. In the tests Korrector™ performed better than other pads and gel pads on the market in terms of shock absorption, increasing bearing surface and reducing pressure points.
The picture above shows the average for the whole of the test. On the left is the before and on the right the after with Korrector™ fitted. The saddle was 1 whole width fitting bigger than the horse required. Green and yellow squares denote pressures above 1.45lbs per sq inch, this level of pressure and higher will start to give problems to the horse.
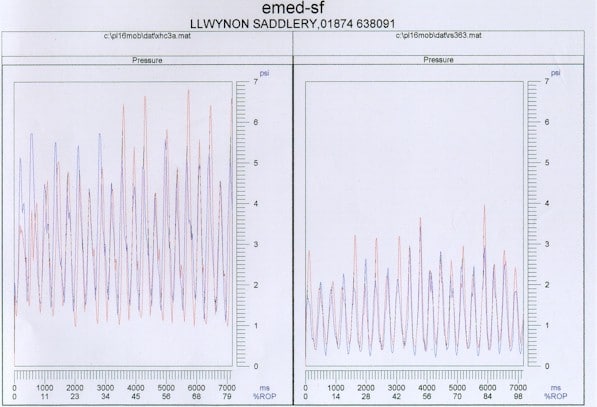
As a example the graphs show the before and after of the same horse, rider and saddle that was too wide for the horse. Before is with nothing under the saddle then after with Korrector™. The rider weighed 13 stone, 182lbs, 83Kg and both tests were ridden in sitting trot on the same ground.
The average pressures in sitting trot were reduced from 2.75 lbs in2 to 1.01 lbs in2. The bearing surface was increased from 188 in2 to 230 in2 so making the saddle more stable and more comfortable for both horse and rider.
It was proved that with a saddle that fitted correctly Korrector™ increased the bearing surface and reduced the pressure points significantly.
When used with a saddle that was too wide for the horse and had a tree that caused rocking front to back, Korrector™ increased the bearing surface and reduced the average pressures dramatically.
| Before | After |
|
|
|
The above graph shows the peak pressures for the same test. The after picture shows how significantly the pressure reduced – both graphs are of the same scale 7lbs per sq inch on the side against time. Red lines denotes the left hand panel pressure and the blue line the right hand panel.
| Before | After |
|
|
|
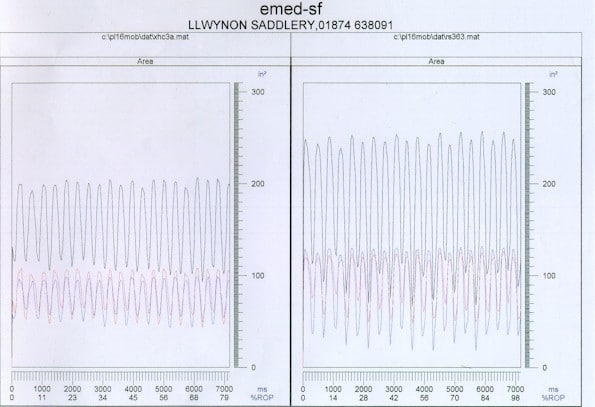
This graph shows the increase in area the Red lines denote the left hand panel area and the blue line the right hand panel, the black is the sum of both panels. The side scale is in sq inches the bottom scale is time.